August 28, 2026 · 10 min read
Why Ranking Reports Can Make an SEO Program Look Better Than It Really Is
Rank tracking is useful. It becomes dangerous when a selected keyword list is mistaken for the market, commercial visibility, or business performance.
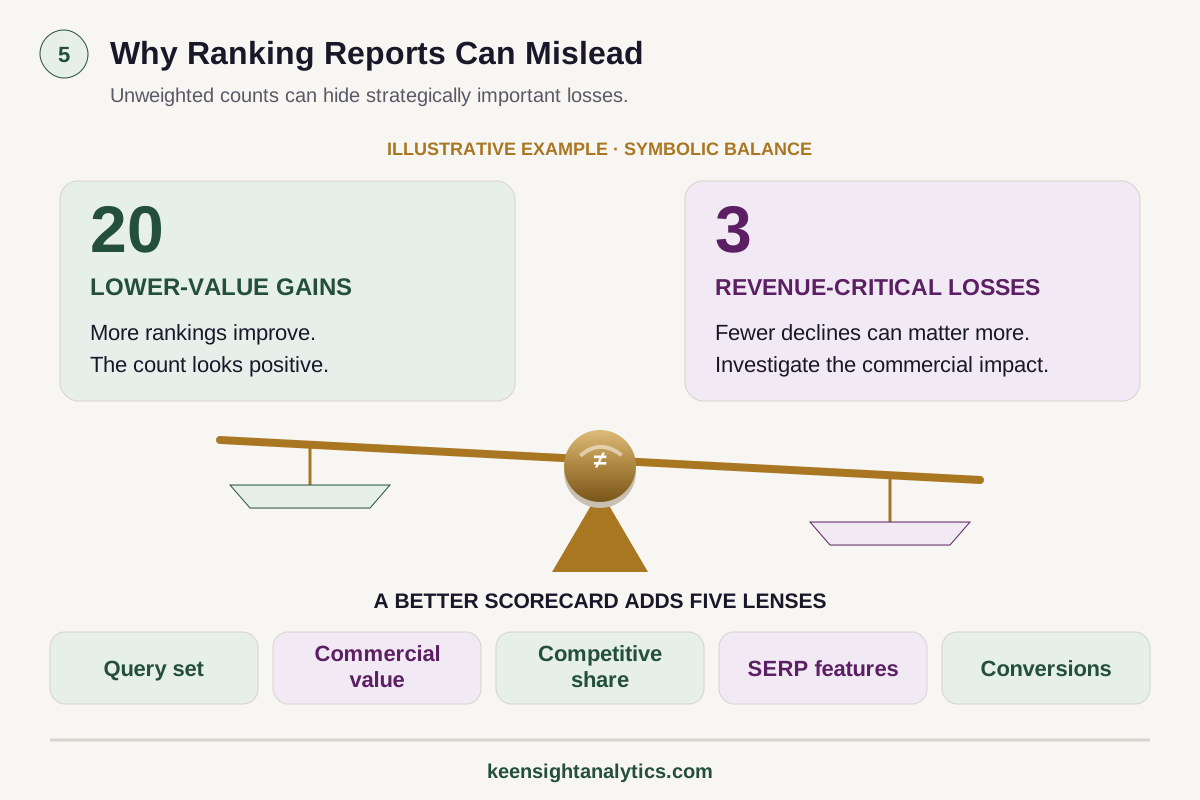
The framework
Why ranking reports can mislead
Illustrative example only; the balance does not show measured business impact.
20 lower-value gains
More rankings improve. The count looks positive.
3 revenue-critical losses
Fewer declines can matter more. Investigate commercial impact.
A better scorecard
Query set, commercial value, competitive share, SERP features and conversions.
Unweighted counts can hide strategically important losses.
Measurement next step
Use a stable baseline and competitive frame before turning a reporting change into an implementation recommendation.Ranking reports are attractive because they compress SEO into a familiar visual language: green arrows are good, red arrows are bad, and an average position creates the impression of a single score.
The problem is not that rankings are useless. The problem is that the tracked keyword set is a model of the market, not the market itself. A program can improve on dozens of tracked terms while losing visibility on the few query groups that generate real demand. It can maintain an average position while competitors expand into new categories. It can gain informational rankings while commercial landing pages weaken.
A strong reporting system uses rankings as one instrument inside a broader view of search-market position.
1. Keyword selection creates reporting bias
The first weakness in a ranking report is often invisible: who chose the keywords, when, and why?
A list built two years ago may no longer reflect current products, services, customer language, local markets, or competitive priorities. A list selected because the company already ranked reasonably well can overstate health. A list dominated by broad informational terms can make a program look successful while revenue-critical service pages lose ground.
Before reading the arrows, audit the query universe. Each tracked term should have a reason to exist: commercial importance, strategic category coverage, local demand, buyer-stage relevance, or competitive significance.
2. Average position is not “where you rank”
Search Console’s position metric is more nuanced than many dashboards imply. Google defines average position as the average topmost position of a site or page across impressions, and the value can vary with query, device, location, result type, and how data is aggregated. Google itself recommends focusing on trends in impressions and clicks rather than position alone. See the current Search Console position documentation.
That matters because a single “average position 6.3” can hide very different realities. One query group may be improving, another declining, and a third producing most of the impressions. Site-level averages can also mask which URL is actually appearing.
Use average position as a directional diagnostic, not a precise statement of where every user sees the business.
3. Unweighted ranking counts treat unequal queries as equal
Suppose twenty tracked keywords improve by one position while three high-intent service queries fall from the top three results to the bottom of page one. A report that counts “20 winners, 3 losers” may look positive even though the commercial impact is negative.
A better model weights visibility by strategic importance, demand, and intent. The weighting does not need to pretend it is perfectly economic. It needs to be transparent enough that leadership knows a core category is not equivalent to a low-value informational variation.
At minimum, separate branded, non-branded, commercial, informational, local, product, and strategic query groups.
4. Rankings do not measure competitive share by themselves
If your position moves from 8 to 6, that tells you something about your visibility. It does not tell you whether the total market is becoming more or less competitive, which domains gained share, or whether a competitor expanded into adjacent queries you do not track.
Search share of voice adds a competitive denominator. Instead of asking only “where do we rank?” it asks “how much of the relevant visibility do we capture compared with the cohort competing for the same demand?”
This is especially valuable when the market changes. A site can improve absolute rankings and still lose relative share if competitors improve faster across a broader query set.
5. Result-page composition changes the value of a position
Position is not the same as screen real estate or click opportunity. Local packs, shopping modules, featured results, video, forums, AI-generated summaries, and other search features can change how much attention a traditional organic result receives.
Google’s Search Console documentation treats complex result elements according to specific impression and position rules. For example, links inside an AI Overview share the position assigned to that result element. That is another reason not to interpret a position number as a simple blue-link rank across every search surface.
When important query groups change result format, annotate the reporting. A stable position with falling clicks may reflect SERP composition, not necessarily a page-quality decline.
6. Local rankings require geographic sampling
Local businesses face another distortion: proximity and geography. A business can appear strongly near its office and weakly across the rest of its service area.
A ranking report checked from one location can therefore overstate local market coverage. Use geographic sampling or grids across the actual trade area, then summarize coverage by service and competitor. See the local search geographic measurement framework.
For multi-location companies, report by market. A national average can hide locations that are effectively invisible.
7. Informational gains can hide commercial losses
One of the most common ways an SEO program looks healthy is through top-of-funnel growth. A site publishes many educational articles, gains hundreds of rankings, and reports rising organic traffic while service, category, or product pages stagnate.
That traffic may still have value, but the report should not imply that all visibility is commercially equivalent.
Separate performance by page type and buyer role. Track service pages, categories, products, locations, comparisons, resources, and editorial content independently. Then evaluate whether supporting content creates useful internal paths into commercial pages.
8. Ranking reports can hide cannibalization
A site may appear to “rank” for a query while the wrong page rotates through the result set. One month the service page appears; the next month a blog post does; then a location page replaces both.
If the dashboard records only the highest site position, that instability may be invisible. Review the ranking URL as well as the position. Search Console lets you inspect pages shown for a specific query, which can reveal competing URLs or changing canonical intent.
When several pages fight for the same job, the solution may be consolidation, internal-link clarification, or stronger page differentiation—not more keyword targeting.
9. Rankings do not tell you whether the traffic converts
Visibility is an intermediate outcome. A ranking report should connect, where measurement allows, to landing-page engagement, qualified conversions, pipeline, revenue, bookings, calls, or another business outcome.
Attribution has limits. SEO often influences buyers across several visits and channels. Do not manufacture precision. But do show whether the pages gaining visibility are producing the kind of activity the business actually values.
If rankings rise while qualified conversions decline, the program needs investigation even if the keyword report is green.
10. A better SEO scorecard uses multiple lenses
A more defensible operating report can combine:
- Competitive search share: weighted visibility across a representative query universe.
- Commercial segment visibility: services, products, categories, locations, or strategic topics.
- Competitive win/loss movement: which domains gained or lost meaningful share.
- Landing-page performance: impressions, clicks, conversions, and quality by page group.
- Technical risk: indexation, migrations, rendering, or other constraints that could materially affect performance.
- Local coverage: geographic visibility where proximity matters.
- AI-search visibility: mentions, citations, sources, and recommendations where commercially relevant.
Rankings remain inside that scorecard. They simply stop carrying more meaning than they can support.
11. Use hypothetical scenarios to test whether the dashboard can mislead
Imagine an illustrative company tracks 100 keywords. Seventy improve, twenty stay flat, and ten decline. The ranking dashboard looks excellent.
Now segment the list. Sixty of the improvements are low-volume informational queries. Five of the declining terms represent the company’s highest-value services. A new competitor also begins ranking for twenty strategic queries that were never added to the tracker. Organic sessions rise because of educational traffic, but demo requests from service pages fall.
Nothing in that scenario makes the rank tracker “wrong.” The reporting model is incomplete.
12. Know when rank tracking is still the right instrument
Rank tracking remains highly useful for migration monitoring, launch validation, local geographic comparisons, controlled experiments, strategic query groups, page-level diagnostics, and competitive win/loss analysis.
It is especially valuable when the query universe is deliberately designed and kept stable enough for trend interpretation.
The mistake is not measuring rank. The mistake is treating a selected ranking list as the outcome of the SEO program.
The executive question is market position
Executives do not need more green arrows. They need to know whether the business is gaining or losing discoverability where buyers make decisions, which competitors are taking share, whether commercial pages are improving, and whether search is contributing qualified business activity.
Rankings can help answer those questions. They cannot answer them alone.
When this becomes a measurement program
Choose the cadence based on the decision—not the dashboard.
Search Benchmarking fits recurring executive comparison. Monitoring fits continuous measurement when an internal team or incumbent executes changes. Search Intelligence fits a deeper one-time diagnosis when leadership needs to understand why visibility changed before choosing implementation.A better scorecard than average rank
Imagine average rank improving from 8.4 to 6.9. That looks positive until the query mix is separated: informational terms improved, while the ten purchase-intent terms that produce most qualified traffic fell from a weighted visibility score of 42 to 31. Two competitors also increased their share of those commercial results.
A better scorecard reports commercial-query visibility, competitive share, landing-page performance, conversions, and major SERP changes alongside position.
Replace the ranking snapshot with a measurement operating model
If the current report cannot explain its query set, weighting, competitor frame or decision use, start with a Free Visibility Preview only when you need a limited external signal before investing in deeper measurement. Use Search Intelligence when the question is why performance changed or which competitor or failure layer is responsible.
Choose Search Benchmarking when leadership needs a stable recurring market comparison across a defined query set and competitor cohort. Choose Monitoring when another team already owns implementation and KeenSight should provide independent recurring observation and change detection. Pair this with the search-visibility-share framework and the executive SEO scorecard to replace rank-count reporting with a decision system.
Decision checkpoint
Make sure the metric is tied to a decision before building another dashboard.
Measurement should establish a stable denominator, competitive frame, and cadence. It should not silently become implementation advice.- 01DefinitionAre the query set, competitor cohort, geography, weighting, page groups, and conversion definitions stable enough to compare over time?
- 02DecisionWhat action will leadership take if the metric moves materially up, down, or sideways?
- 03OwnershipDoes KeenSight only measure, or is there a separate requirement for diagnosis or managed implementation?
What a Ranking Report Misses
Query selection bias
The tracker can look healthy because the selected keywords no longer represent the market or commercial priorities.
Competitive context
A position change does not show whether competitors expanded faster or captured adjacent demand.
Commercial quality
Informational ranking gains can coexist with declining visibility and conversions on revenue-critical pages.
SERP reality
Local packs, AI features, shopping, video, and other result types can change the value of the same nominal position.
Search measurement
Choose the measurement product by the decision and cadence.
Compare other ways to get help
Measure search as a market, not a keyword list
Search Benchmarking is designed to show competitive visibility and movement across the query groups that matter, without turning measurement into implementation.
Keep Reading
How to Measure SEO Market Share
Build a stable query universe, competitor cohort, weighting model, and segment-level share view.
Read article →Search Share of Voice vs Rankings
Understand the difference between individual positions and competitive market visibility.
Read explainer →Competitive Win/Loss Reporting
Identify where visibility moved and which competitors captured the change.
Read explainer →Make it specific
See what the market looks like for your company.
The free visibility preview turns a broad search topic into a limited personalized baseline.