August 28, 2026 · 11 min read
How to Measure Whether SEO Is Actually Gaining Market Share
Traffic growth is not the same as competitive gain. A market-share model asks whether your brand is capturing more of the search visibility available across the categories that matter.
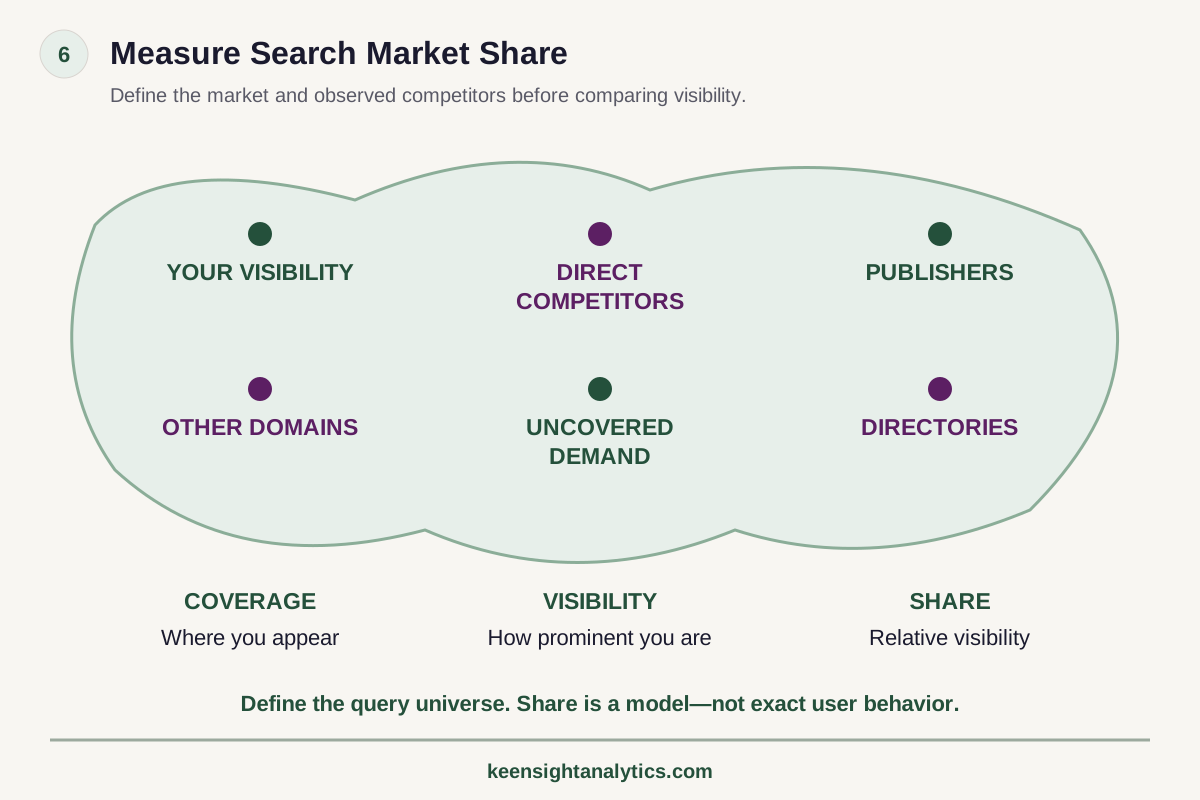
The framework
Measure search market share
Define the market and observed competitors before comparing visibility.
Query universe
Your visibility, direct competitors, publishers, other domains, directories and uncovered demand.
Coverage
Where you appear.
Visibility
How prominent you are.
Share
Your relative visibility within the defined market.
Share is a model, not exact user behavior.
Measurement next step
Use a stable baseline and competitive frame before turning a reporting change into an implementation recommendation.Organic traffic can grow while a company loses search market share. Traffic can fall while the company holds its competitive position. Brand demand, seasonality, category growth, SERP changes, analytics configuration, and new search features can all move traffic without telling you whether the business is becoming more or less visible relative to competitors.
Search-market-share measurement asks a narrower and more strategic question: across the query universe that matters to the business, are we capturing more or less of the available visibility than the competitors competing for the same demand?
The answer requires a model. That model will never be a perfect census of all search behavior, so transparency matters more than false precision.
1. Define the market before calculating share
Market share is meaningless without a denominator. Start by defining the search market you are trying to measure.
For a regional professional-services firm, the market might be a set of high-value services across three metropolitan areas. For a B2B SaaS company, it could include category terms, use cases, integrations, comparisons, and problem-led queries. For ecommerce, it may be category and product-intent query groups. For a multi-location brand, the market may need to be defined separately by location.
Document what is in scope and what is not. If the model excludes branded search, say so. If it includes informational discovery because that content influences pipeline, define the relevant stages.
2. Build a stable query universe
The query universe is the sample used to represent the market. It should be broad enough to cover meaningful demand and stable enough that changes over time can be interpreted.
Group queries by dimensions the business actually manages:
- service, product, or category;
- commercial versus informational intent;
- location or service area;
- buyer stage;
- strategic priority;
- brand versus non-brand;
- problem, solution, comparison, and implementation questions.
Maintain a stable core set and version the model when material additions are necessary. If half the keywords change every month, the resulting “share” trend mostly measures changes in the sample.
3. Choose the competitor cohort from the results
The companies named by the sales team are not necessarily the domains competing for search visibility. Publishers, marketplaces, directories, aggregators, review sites, government sources, communities, and indirect competitors can capture meaningful portions of the result set.
Build the cohort empirically. Identify the domains or local businesses that repeatedly appear across the query universe. Then segment them by where they compete. A publisher may dominate informational queries but be irrelevant to transactional terms. A directory may dominate local discovery while direct competitors dominate organic service pages.
Update the cohort deliberately. A fast-growing entrant may matter more strategically than a historical competitor with a larger total footprint.
4. Convert positions into visibility weights
Raw rank is difficult to aggregate across hundreds of queries. A share-of-voice model usually converts positions into a visibility score, with higher positions receiving more weight than lower positions.
An illustrative model might assign a visibility factor of 1.0 to the top result, then progressively smaller factors to lower positions. Another model may use estimated click-through curves. The exact weighting is less important than consistency and transparency.
A simplified calculation can be expressed as:
Weighted visibility = query importance × position visibility factor
Then:
Search share = your weighted visibility ÷ total weighted visibility across the defined competitive cohort
This is a model, not a claim about exact user behavior. Document the assumptions so leadership understands what a one-point gain represents.
5. Weight queries according to business importance
Treating every keyword equally creates the same problem as an unweighted ranking report. A niche strategic service may matter more than a broad high-volume definition. A location with strong margins may deserve more weight than a low-priority market.
Possible weighting inputs include estimated demand, commercial intent, strategic priority, revenue potential, funnel proximity, or a simple tier system agreed with leadership.
Avoid pretending the weight is a forecast of revenue unless the data supports that level of precision. The objective is to prevent low-value query volume from overwhelming the categories the business actually cares about.
6. Report share by segment, not only sitewide
Sitewide share is useful for an executive headline, but it can hide the decision.
A company may gain overall share while losing its most profitable category. A multi-location brand may grow nationally while a strategically important city collapses. A SaaS company may gain educational visibility while losing vendor-comparison queries.
Break the model into segments: service lines, products, locations, intent groups, page types, industries, or other commercial units. The best search-market-share report can answer both “are we gaining?” and “where exactly?”
7. Add competitive win/loss movement
Share tells you the result. Win/loss analysis helps explain it.
For each reporting period, identify the query groups where your visibility gained or declined materially and which competitors moved in the opposite direction. Then inspect the winning pages.
Did a competitor launch a new service-page architecture? Consolidate duplicate pages? Publish original research? Expand local locations? Gain relevant references? Improve product or category pages? Did a directory or publisher take the result set away from vendors entirely?
This turns a competitive score into an actionable diagnostic. KeenSight’s competitive win/loss reporting framework goes deeper on the method.
8. Pair share with demand trends
Competitive share and market demand answer different questions.
If search demand for the category falls 20 percent while your competitive share holds steady, traffic may decline even though relative position remains healthy. If demand grows 30 percent but your share falls sharply, traffic can stay flat while the competitive picture deteriorates.
Track available demand indicators alongside share so leadership can distinguish “the market got smaller” from “we lost more of the market.”
9. Pair share with landing-page and conversion evidence
Search-market share measures discoverability. It does not prove profitability.
Connect major query segments to the landing pages expected to serve them. Monitor impressions, clicks, engagement, qualified conversions, pipeline, revenue, or another downstream metric where attribution is defensible.
If share rises in a segment but the associated commercial pages do not convert, the problem may have moved downstream. If share falls while conversions remain strong, the business may need to decide whether the lost visibility matters or whether the model is overweighting low-value demand.
Measurement should inform decisions, not force every metric to move in the same direction.
10. Local market share requires geography
For local businesses, the query universe needs a geographic dimension. Ranking from one coordinate cannot represent a city or service area.
Sample important service queries from a grid of representative points. Calculate coverage or visibility by location and compare the businesses appearing across the market. A local competitor may own one side of the city and be nearly absent on the other.
For multi-location brands, roll local markets up only after each market is measured correctly. A national average can hide severe local blind spots.
11. AI-search market share needs its own definitions
AI-generated search experiences can also be measured competitively, but the metrics are different. Instead of forcing them into organic rank, define prompt-level measures such as mention share, citation share, recommendation share, source-domain share, and competitive inclusion rate.
Use a stable prompt universe tied to commercial decisions, just as you would use a stable query universe for traditional search. Keep AI measurement separate enough that its volatility and source behavior are visible.
Then place it beside organic and local visibility rather than claiming the surfaces are directly interchangeable.
12. Version the methodology
A market-share model changes over time. New products launch. Locations open. Query language evolves. Competitors enter. Search interfaces change.
When the methodology changes materially, version it. Record which queries were added or removed, whether weighting changed, whether the competitor cohort changed, and whether the visibility curve was updated.
Without version control, a methodology change can appear to be a performance change.
13. Use cadence according to the decision
Weekly data can detect anomalies. Monthly reporting is often appropriate for operating trends. Quarterly analysis is better for strategic share shifts, category investment, budget, and ownership decisions.
Avoid overreacting to daily movement unless the use case is incident response, migration monitoring, or another high-volatility event. Market share is most useful when enough time has passed for the trend to become meaningful.
14. Know the limitations of the model
No keyword set captures every query. Demand estimates are imperfect. Rank trackers sample locations and devices. Search personalization and result features vary. Third-party click curves are estimates. Search Console omits some query detail for privacy and aggregation reasons.
Those limitations do not make market-share measurement useless. They mean the model should be interpreted as a consistent competitive index rather than an exact census of every search impression.
A good methodology states its limitations instead of hiding them behind a decimal point.
15. The operating question is “where did share move, and why?”
The best monthly or quarterly review is not a slide that says share rose from 18.4 to 19.1 percent. It explains which segments moved, which competitors gained or lost, what pages or result types drove the change, whether demand expanded or contracted, and what the business should do next.
That turns SEO reporting into market intelligence.
Search market share makes SEO comparable over time
Traffic will always be influenced by forces beyond SEO. Rankings will always be a sample. A defensible search-market-share model gives leadership a stable way to ask whether the company is becoming more or less discoverable relative to the market it competes in.
The model does not eliminate uncertainty. It makes the uncertainty explicit enough to manage.
When this becomes a measurement program
Choose the cadence based on the decision—not the dashboard.
Search Benchmarking fits recurring executive comparison. Monitoring fits continuous measurement when an internal team or incumbent executes changes. Search Intelligence fits a deeper one-time diagnosis when leadership needs to understand why visibility changed before choosing implementation.Call it search visibility share
This framework measures share of observable search visibility, not economic market share. For example, assign weights of 5, 3, and 1 to high-, medium-, and low-value query groups, calculate normalized visibility for each domain, then divide the brand's weighted score by the competitive cohort total.
If the brand scores 180 weighted points in a cohort totaling 900, search visibility share is 20%. Its value comes from repeating the same methodology—not pretending the percentage equals revenue share.
Turn search visibility share into a recurring competitive baseline
Search visibility share is most useful when the denominator stays stable enough to compare over time. If you still need to establish whether there is a meaningful visibility gap, begin with the Free Visibility Preview. If the share loss is clear but the cause is not, Search Intelligence can separate demand, competitor, page, technical, content and authority explanations before anyone changes the program.
Use Search Benchmarking when the weighted query universe, competitor cohort and reporting cadence should become a recurring executive baseline. Use Monitoring when implementation remains with another team and KeenSight should track movement without taking ownership of execution. The companion article on finding the competitors actually taking visibility helps keep the denominator commercially relevant.
Decision checkpoint
Make sure the metric is tied to a decision before building another dashboard.
Measurement should establish a stable denominator, competitive frame, and cadence. It should not silently become implementation advice.- 01DefinitionAre the query set, competitor cohort, geography, weighting, page groups, and conversion definitions stable enough to compare over time?
- 02DecisionWhat action will leadership take if the metric moves materially up, down, or sideways?
- 03OwnershipDoes KeenSight only measure, or is there a separate requirement for diagnosis or managed implementation?
A Defensible Search-Share Model Needs
A stable market definition
Define the products, services, locations, intents, and query groups that represent the competitive search market.
Transparent weighting
Convert positions and query importance into a consistent visibility model without pretending the score is exact revenue.
A real competitor cohort
Build the cohort from domains and businesses that actually capture visibility, not only the sales team’s competitor list.
Segment-level interpretation
Explain where share moved, which competitors captured it, what demand did, and what action should follow.
Search measurement
Choose the measurement product by the decision and cadence.
Compare other ways to get help
Build an independent baseline for search-market visibility
Search Benchmarking measures competitive visibility and change. It stays measurement-focused when your internal team or incumbent agency owns execution.
Keep Reading
Why Ranking Reports Can Mislead
Understand why a selected keyword list can overstate the health of an SEO program.
Read article →Search Share of Voice vs Rankings
A focused explanation of why competitive visibility and individual positions answer different questions.
Read explainer →Executive Search-Market Reporting
Turn visibility data into decisions leadership can use.
Read explainer →Make it specific
See what the market looks like for your company.
The free visibility preview turns a broad search topic into a limited personalized baseline.