August 28, 2026 · 9 min read
How to Measure Local SEO Across an Entire Service Area
A single rank from one ZIP code cannot represent a city. Local SEO is geographic market competition, so the measurement system needs geography built in.
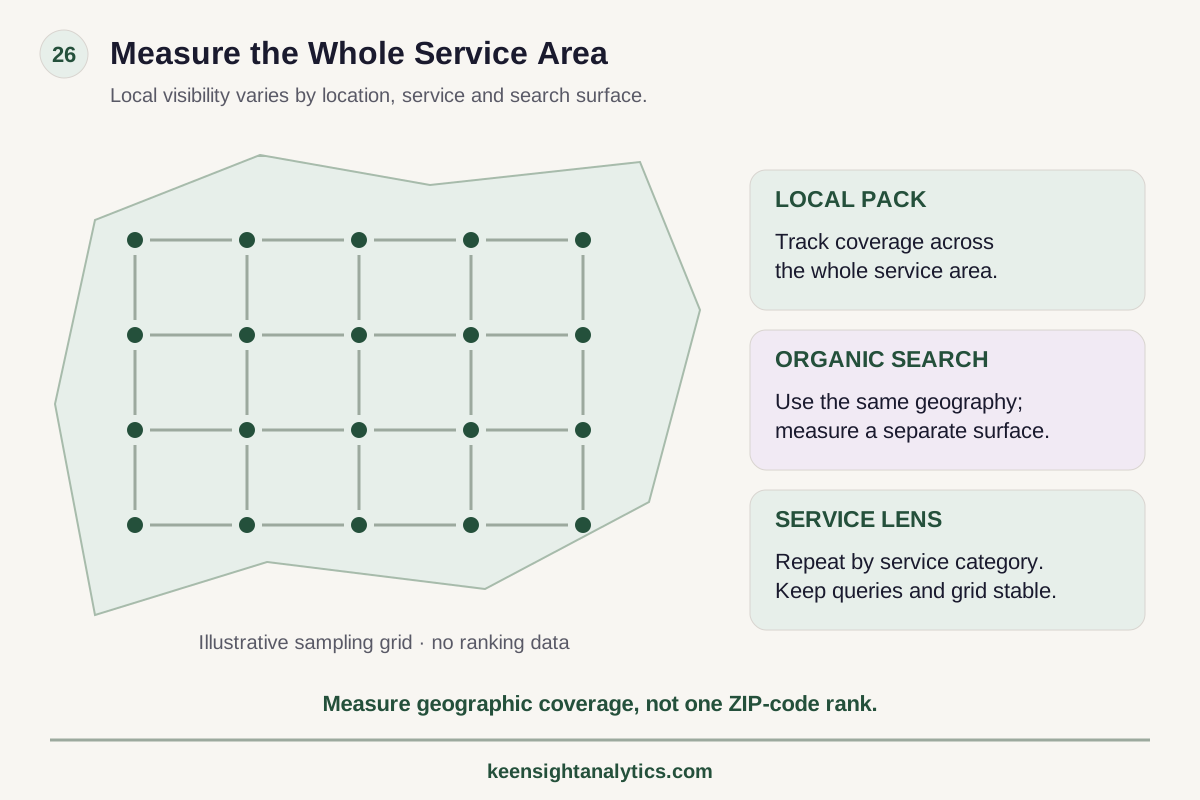
The framework
Measure the whole service area
Local visibility varies by location, service and search surface.
Controlled sample points
Use a stable geographic grid across the commercial service area. The original diagram contains no ranking data.
Local pack
Track coverage across the whole service area.
Organic search
Use the same geography and measure a separate surface.
Service lens
Repeat by service category; keep queries and grid stable.
Measure geographic coverage, not one ZIP-code rank.
Local search next step
Local visibility has to be measured across the market you actually serve—not from one device or ZIP code.Local search visibility is not one number.
A business can appear prominently two blocks from its office and disappear several miles away. A competitor can dominate one service category but be weak in another. One manual search or one city-level average hides those differences.
To measure local SEO properly, treat the service area as a geographic market.
1. Define the commercial service area
Start with the market the business actually serves—not the largest radius a tool allows.
Use operational reality: drive time, delivery boundaries, customer density, licensing or jurisdiction, branch overlap, franchise territories, and the locations from which customers realistically convert.
A contractor may serve a broad metro. A dental practice may draw primarily from a tighter trade area. The measurement geography should reflect the business model.
2. Build a controlled query set
Choose queries tied to real revenue categories.
Group them by intent:
- core service;
- emergency or urgent need;
- high-value specialty service;
- brand or equipment type where commercially relevant;
- problem or symptom;
- near-me or implicit local intent;
- location-modified queries where users actually search that way.
Keep a stable core set for trend measurement. Add exploratory queries separately so the benchmark does not change silently.
3. Sample geography systematically
Create representative measurement points across the service area.
A regular grid is useful, but it should be adapted to market shape. Water, mountains, highways, low-population areas, and service boundaries can make a perfectly uniform grid commercially meaningless.
Weight or segment points where customer value or population density differs materially.
4. Track local-pack and organic visibility separately
The local pack and organic results are related discovery surfaces but not the same result set.
Record where the business appears in local results and where its website appears organically for the same query set. A company can be strong in Maps and weak organically, or the reverse.
That distinction matters because the remediation path may differ.
5. Measure coverage, not only average rank
Average rank can hide severe gaps.
Useful coverage metrics can include:
- percentage of grid points with top-three local visibility;
- percentage with any local-pack appearance;
- percentage with page-one organic visibility;
- weighted coverage across high-value query groups;
- areas where no meaningful brand visibility exists.
Coverage maps make it easier to see whether the brand owns the market or only the blocks near its location.
6. Create empirical competitor cohorts
Local competitors should be derived from the result set.
Record which businesses appear across the grid and query groups. Then identify the companies with the greatest overlap and strongest geographic coverage.
The competitor across the street may not be the search competitor. A chain farther away may own far more of the local market.
7. Segment by service category
A composite local score can hide category-specific weakness.
An HVAC company may dominate AC repair but have little heat-pump visibility. A dental group may rank strongly for general dentistry but poorly for implants. A law firm may perform differently by practice area.
Report service categories independently before combining them into a summary metric.
8. Compare proximity patterns carefully
Location matters in local search, but do not reduce every pattern to distance.
Compare visibility against geography, competitors, profile categories, review strength, website relevance, local pages, business facts, and market structure. The objective is to identify patterns—not infer a proprietary ranking formula from a grid.
9. Add review and profile context
For the competitors appearing most often, compare observable profile and reputation factors such as categories, review volume, recency, business information, photos, services, and website destinations.
This gives the map operational context without pretending any single attribute guarantees local ranking.
10. Measure change against a stable baseline
Use the same core queries, geographic points, and weighting method when evaluating trend.
If the service area expands, a location moves, or a query set changes, version the methodology. Otherwise, a lower coverage score may simply reflect a larger denominator.
11. Control for seasonality
Demand can change dramatically for HVAC, roofing, travel, healthcare, and other local categories.
Use year-over-year context and service-level demand where possible. Visibility share can help separate market movement from raw traffic changes.
12. Connect geographic visibility to conversion data
Search coverage is not the commercial endpoint.
Compare local visibility with calls, bookings, forms, directions, lead quality, or revenue by market where defensible. A grid point with low population or low service profitability may deserve less priority than a smaller but commercially important gap elsewhere.
13. Use the map to prioritize action
Different geographic patterns suggest different investigations.
- Strong near the location, weak farther out: examine market reach, competition, service-area expectations, local relevance, and whether a second real location is an operational question rather than an SEO trick.
- Weak everywhere: inspect profile eligibility, categories, reviews, website relevance, technical health, and broader authority.
- Strong for one service, weak for another: inspect service-page quality, categories, and competitor specialization.
- Organic strong, Maps weak: investigate the local entity and profile layer.
- Maps strong, organic weak: inspect website architecture, content, technical health, and authority.
14. Separate monitoring from execution
A measurement program can tell you where visibility changes and which competitive patterns deserve investigation. It does not automatically execute profile changes, page development, review operations, technical remediation, or local outreach.
Define who owns the response before the dashboard identifies the problem.
15. A practical local measurement cadence
Monitor major anomalies regularly, review market-level movement monthly, and evaluate structural changes quarterly or after material business events such as a location move, opening, closure, rebrand, or major website change.
Do not overreact to one grid run. Look for repeated geographic patterns.
Local SEO is market coverage
The useful question is not “What rank are we in Phoenix?” It is “Where across the Phoenix market are we visible for the services that matter, which competitors own the gaps, and is our coverage expanding or shrinking?”
Once the measurement system asks that question, local SEO becomes much easier to manage as a business problem.
When this becomes a local-search operating problem
Connect locations, services, entities, reviews, and geography.
Use Local SEO when KeenSight needs to own the implementation across website and local-search layers. Use Search Intelligence when the market-level failure is still unclear, especially across multiple locations or service areas.Local-search work cannot guarantee Map Pack or local ranking outcomes.Choose the grid before reading the rankings
Set the grid from the real trade area rather than a convenient radius. Use enough points to capture meaningful neighborhood or service-area variation, keep the same points for trend measurement, and run a stable set of service-intent queries at each point. Summarize coverage as the percentage of important points where the business is visible, alongside competitor coverage.
Change grid density only when the market definition changes.
Turn local rank grids into a repeatable market measurement system
A local grid is useful only when the query set, map points, service areas, device assumptions, and competitor cohort are stable enough to compare. Use Search Benchmarking when recurring market measurement is the need and another team owns implementation. Use Search Intelligence when the business first needs to understand why one market is weaker or whether the problem is demand, proximity, profile strength, website relevance, competition, or measurement design.
Choose Local SEO when KeenSight should execute across Business Profiles, location/service pages, reputation priorities, local entities, and on-site optimization. Choose managed KeenSight Search when local measurement is only one part of a broader recurring search program. This framework does not promise Map Pack placement; it creates a more reliable way to observe local-market movement.
Decision checkpoint
Define the actual local market before prescribing local SEO work.
A single ranking from one device is not enough to diagnose a geographic visibility problem.Local SEO can improve the system around local discovery but cannot guarantee Map Pack placement or a specific local ranking.- 01MarketAre the relevant locations, service areas, neighborhoods, and high-value local queries defined?
- 02EvidenceDo you have geographic visibility, profile/entity, review, website, and competitor evidence rather than one Map Pack screenshot?
- 03ExecutionIs the gap a measurement problem, a one-time diagnosis, or recurring local implementation across listings, pages, reputation, and entities?
Measure the Market, Not One Pin
Commercial geography
Define the real trade area before selecting measurement points.
Query segments
Track meaningful service categories independently so averages do not hide weak offers.
Coverage metrics
Report how much of the market is visible, not only an average local rank.
Competitor cohorts
Derive competitors from who actually appears across the grid and query universe.
Local SEO next steps
Connect geographic evidence to the right local operating model.
Compare other ways to get help
See where local visibility actually breaks down
KeenSight Search Benchmarking can measure local geographic coverage while your team or incumbent provider retains execution ownership when monitoring is the requirement.
Keep Reading
Multi-Location SEO Program Structure
Build central governance and local evidence across a portfolio of locations.
Read article →Local Search Competitor Cohorts
Define competition from the businesses that actually appear in-market.
Read explainer →Local Search Geographic Measurement
Review the deeper methodology behind grid and market-coverage measurement.
Read explainer →Make it specific
See what the market looks like for your company.
The free visibility preview turns a broad search topic into a limited personalized baseline.